Track and take action on engagement & sentiment—everywhere learning happens.
Designed for answers, not dashboards
Most platforms bury reporting in static dashboards. We built Insights differently.
Every track, course, event, article, and video comes with built-in engagement and sentiment data. You see who’s completed, who’s stuck, and how content is received—right where learning happens. Insights surface answers immediately and let you drill deeper, filter by cohort, or take bulk actions, so data leads directly to impact.
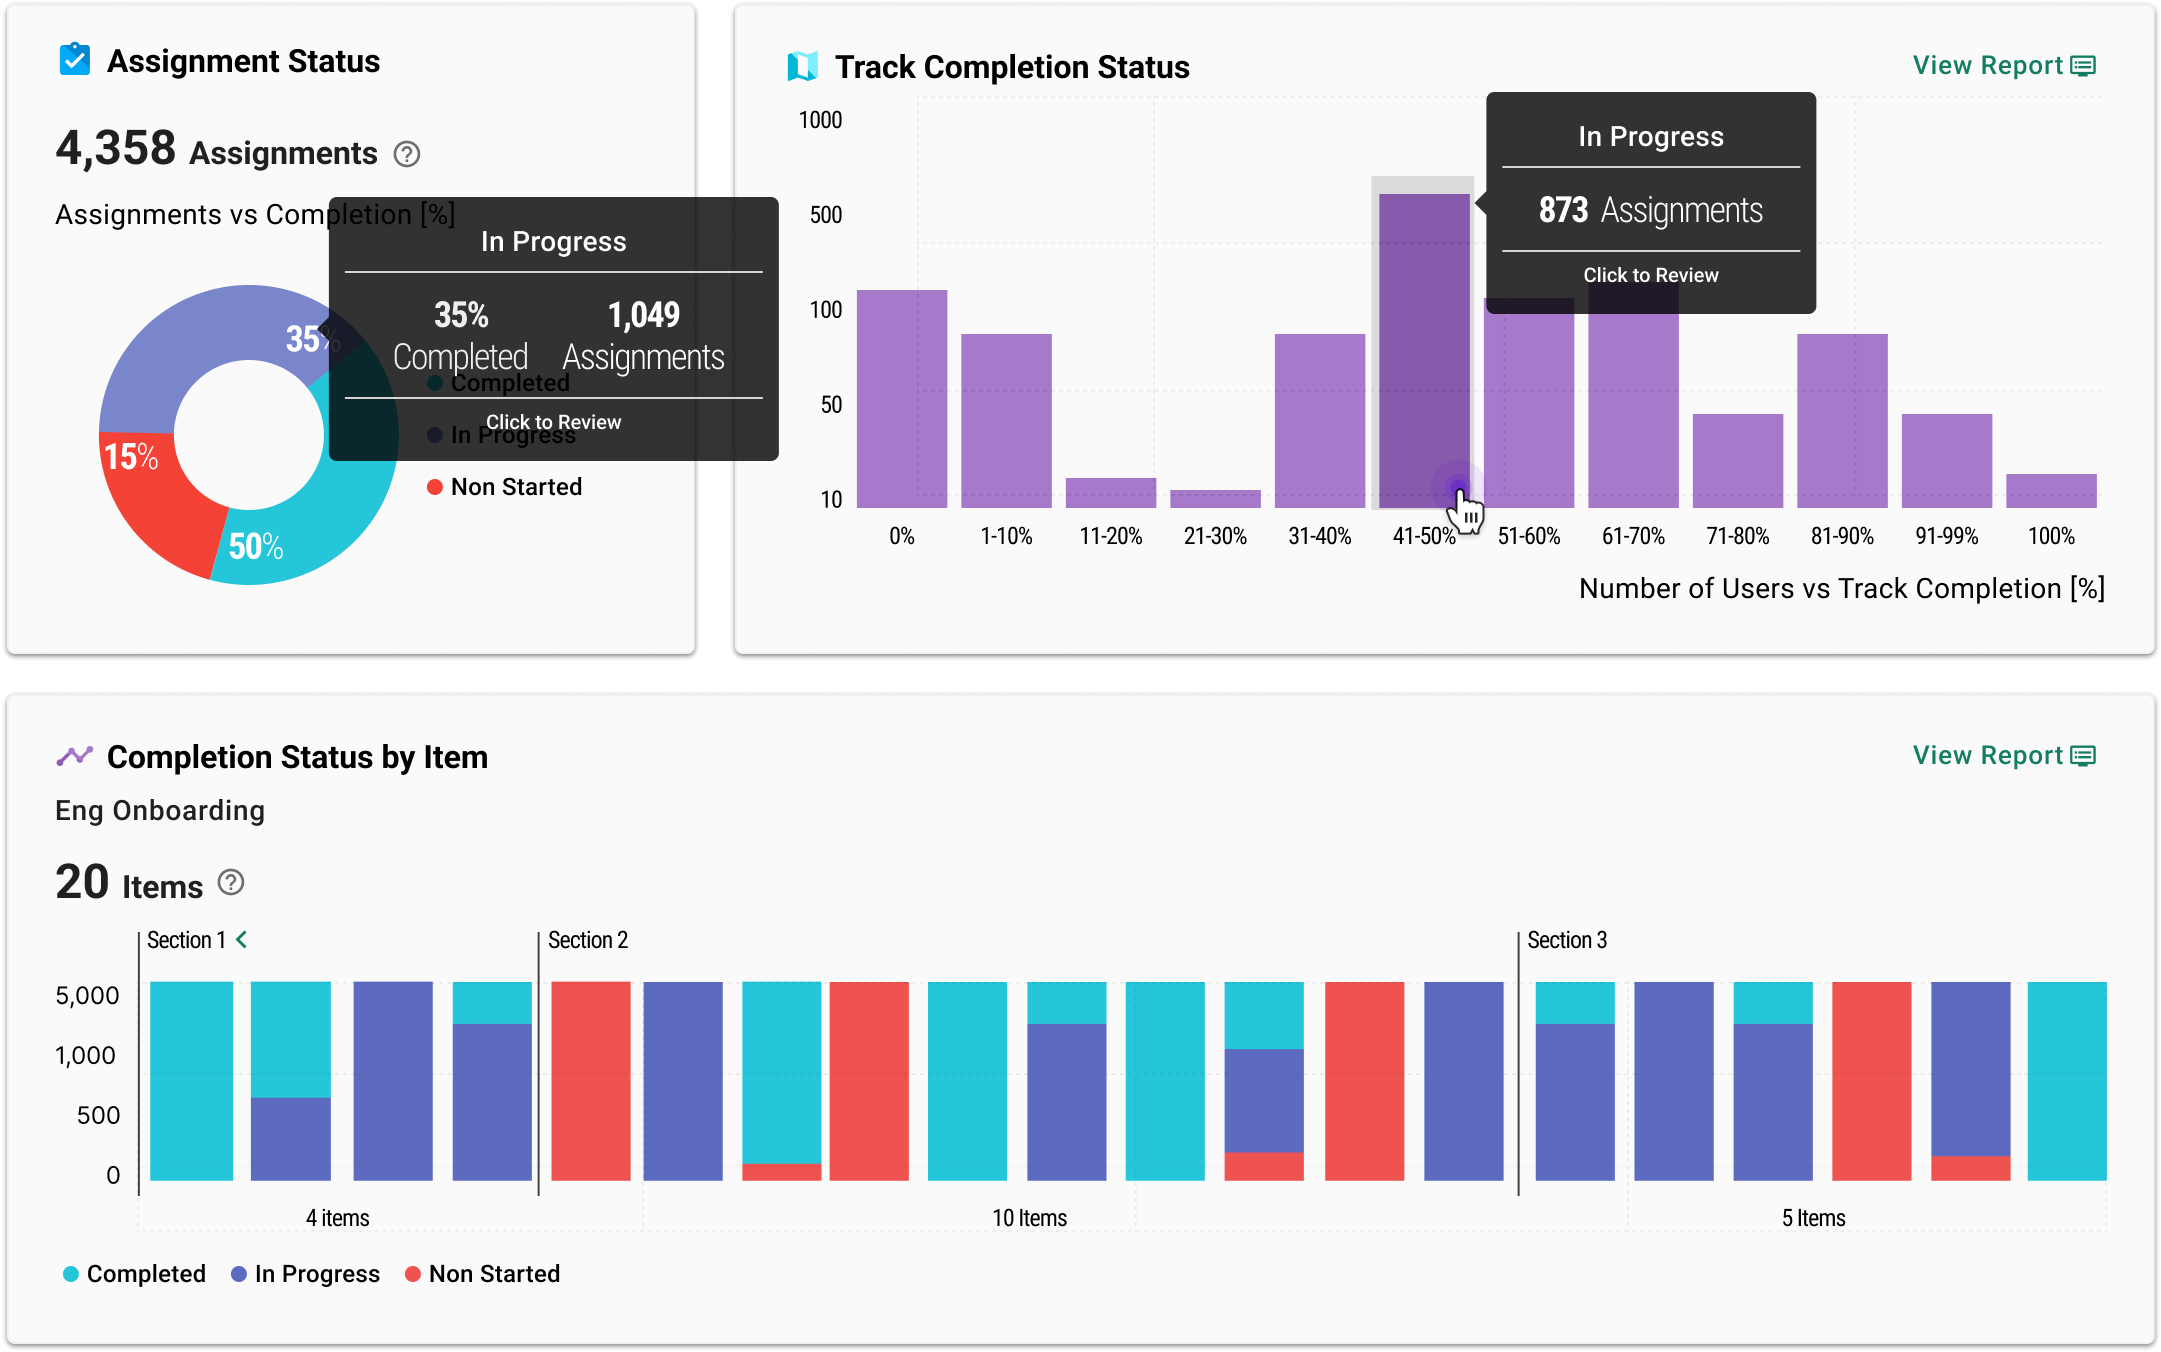
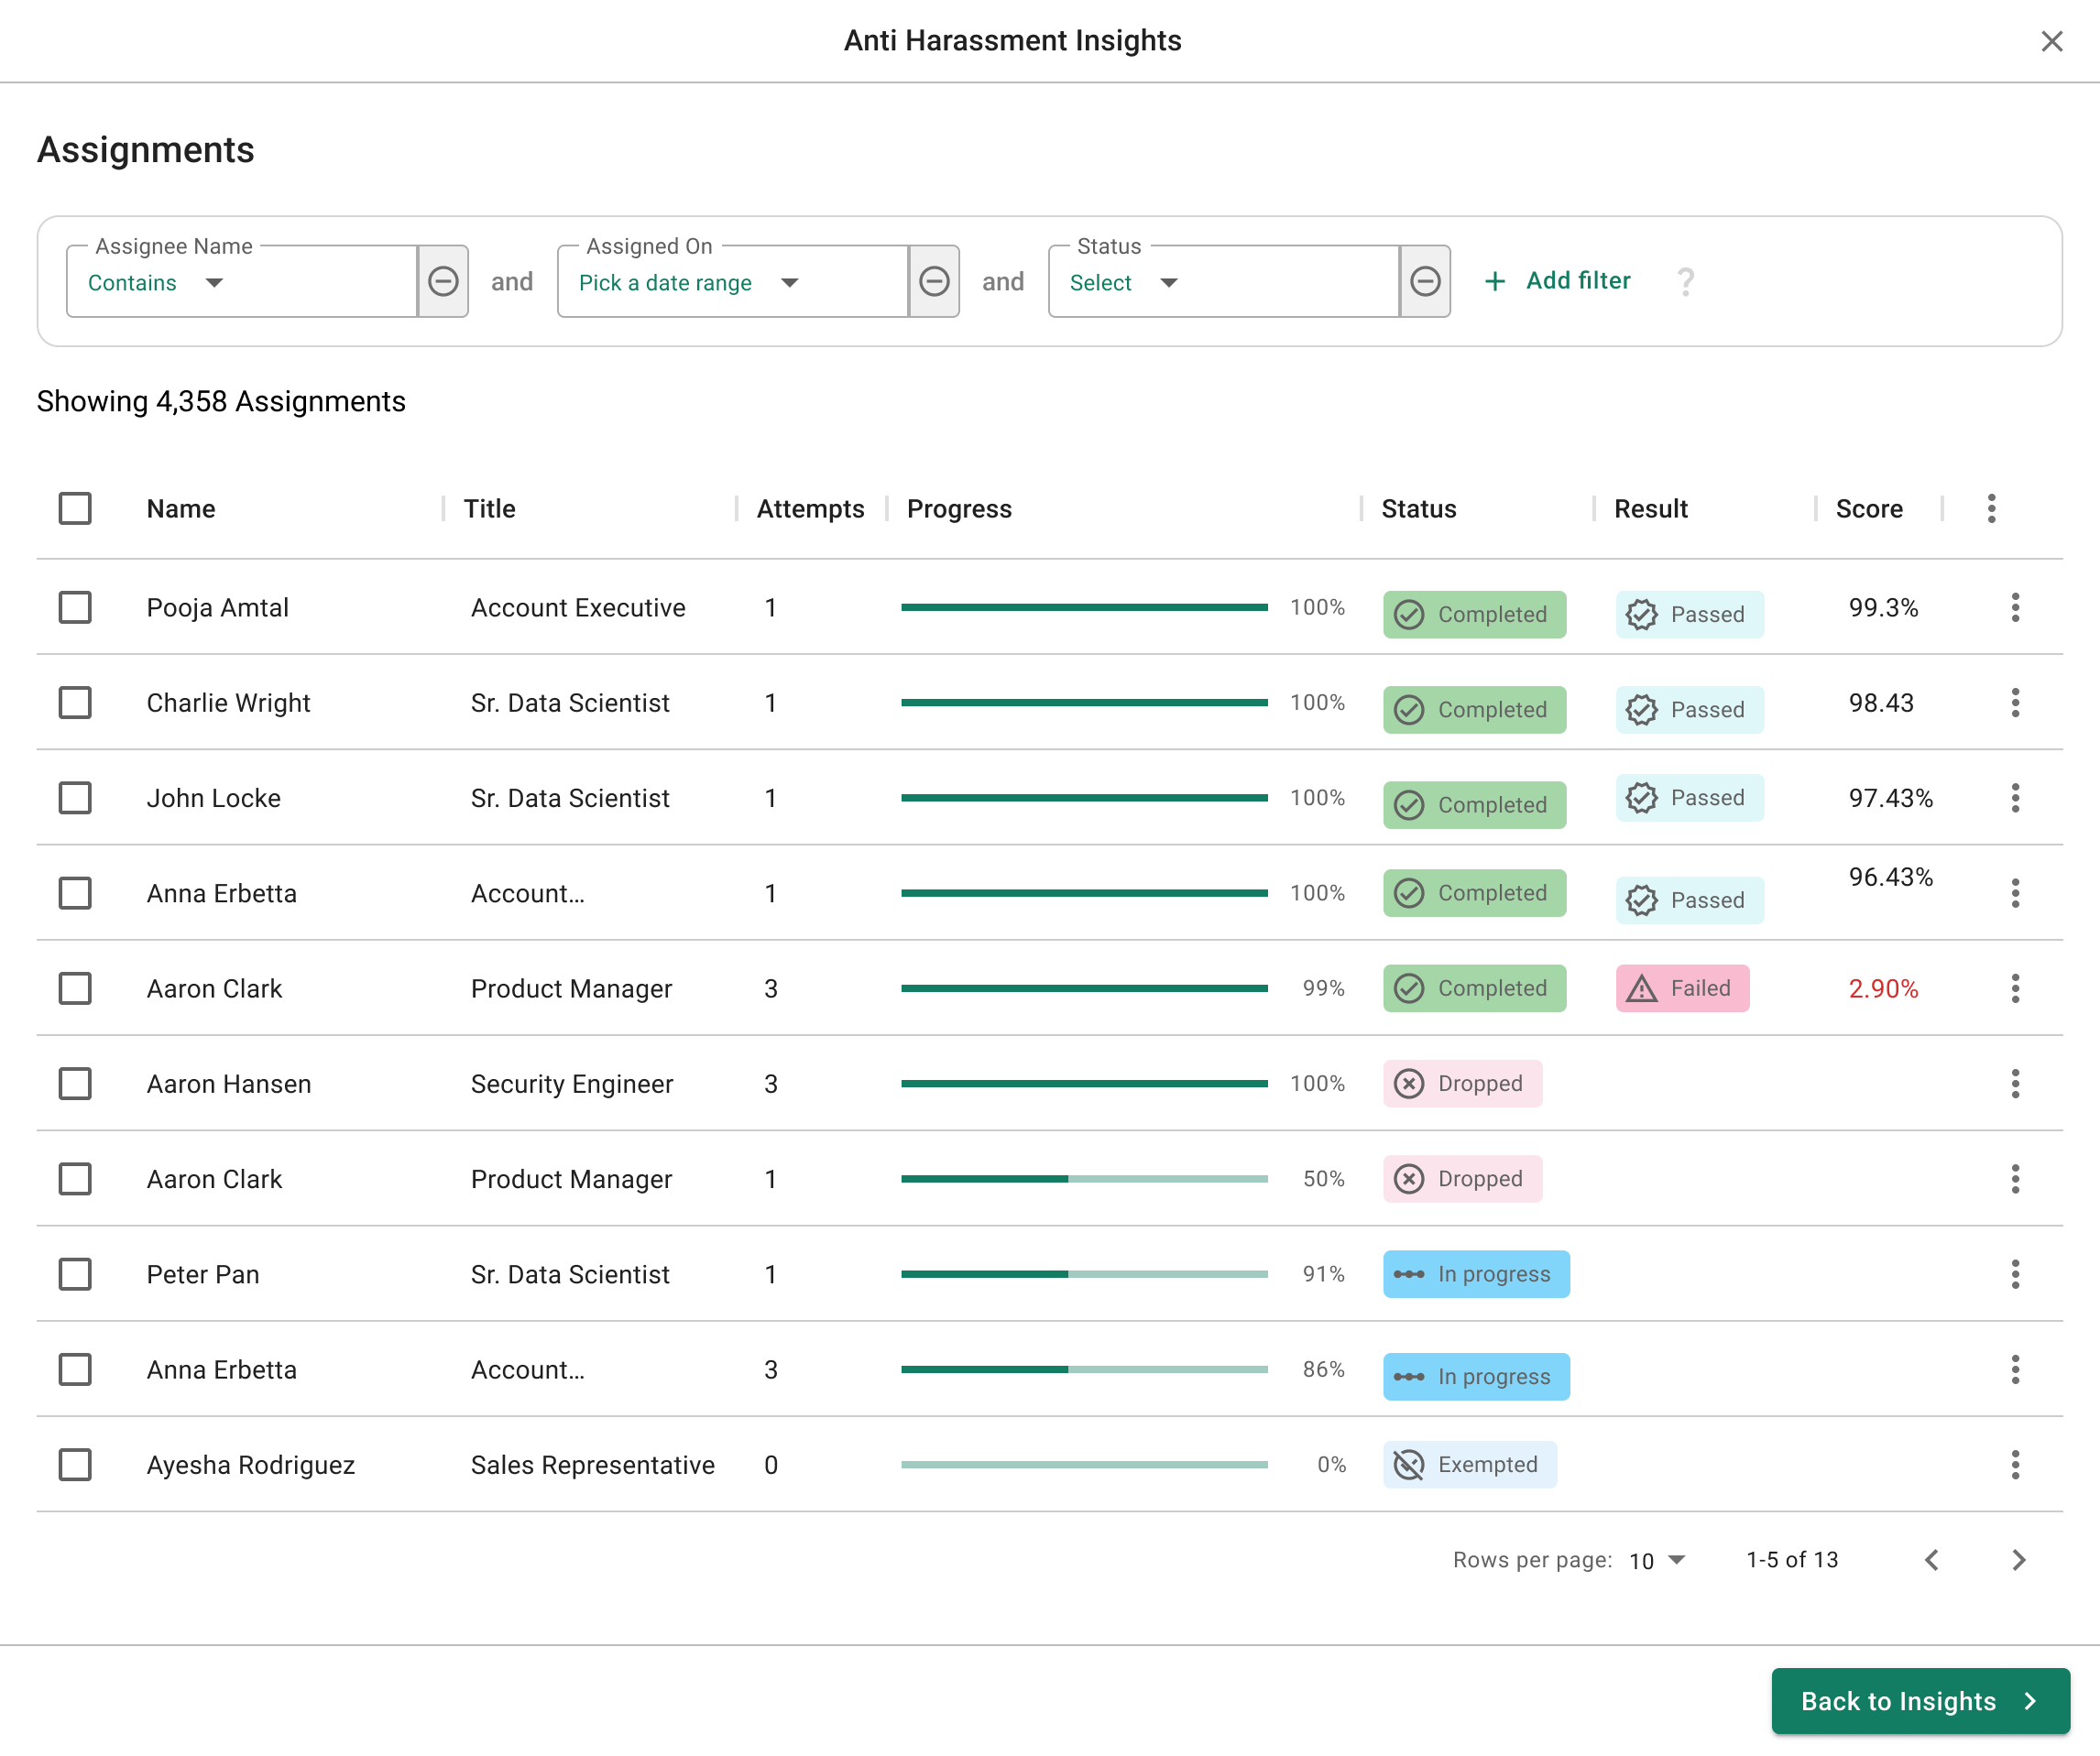
Measure engagement and sentiment
Every learning program in PlusPlus comes with two critical signals:
Engagement
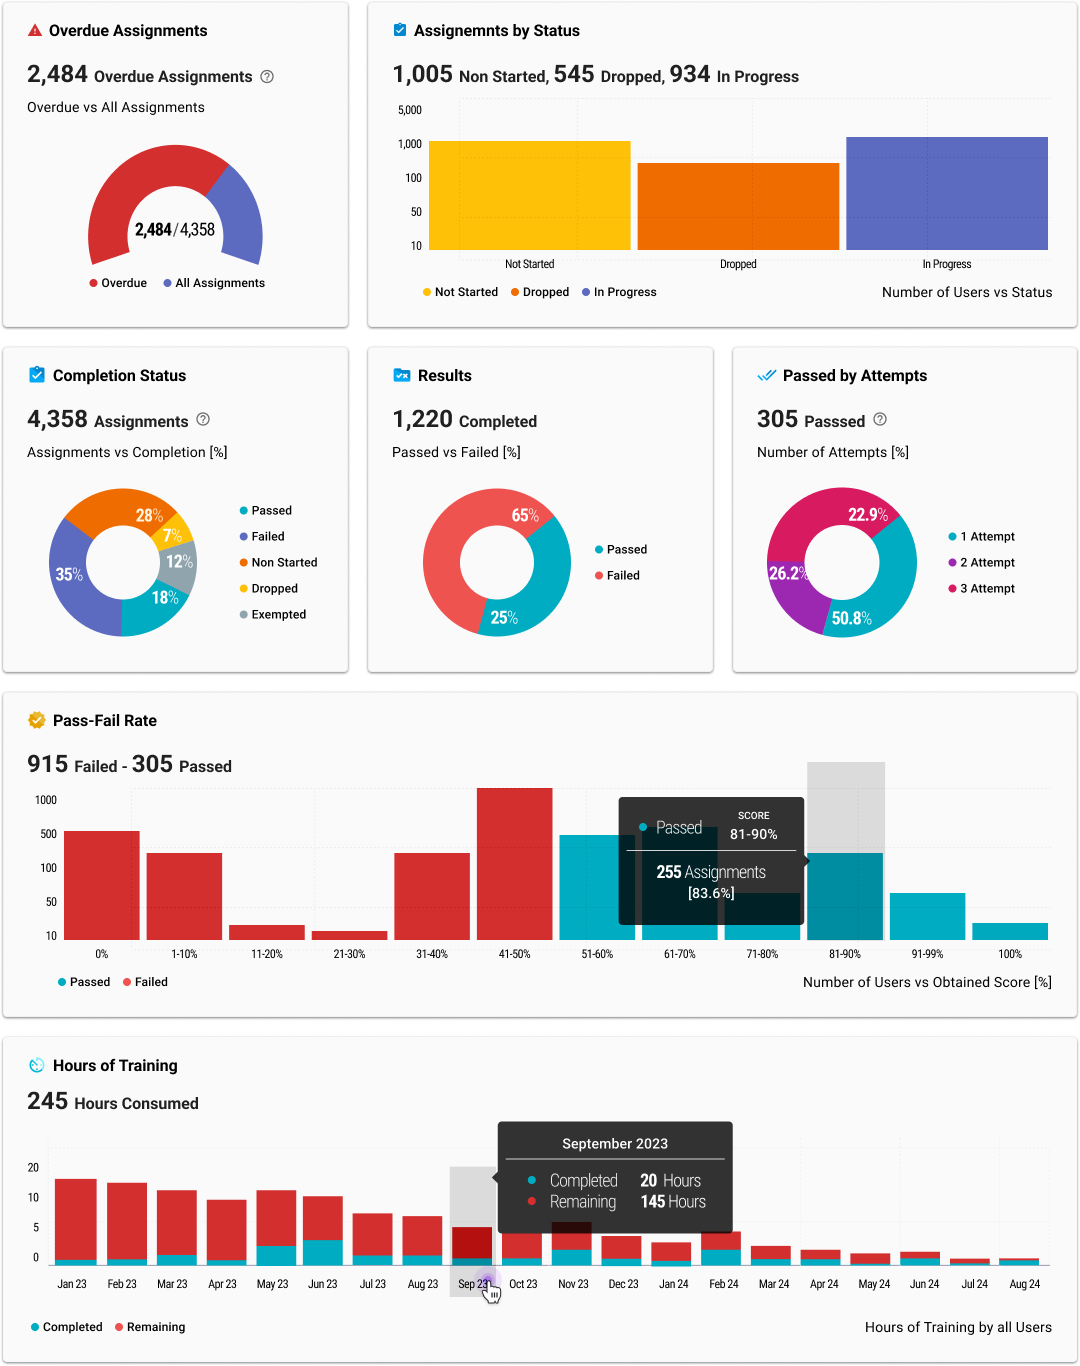
Instantly see who’s started, who’s in progress, who’s completed, and who’s overdue.
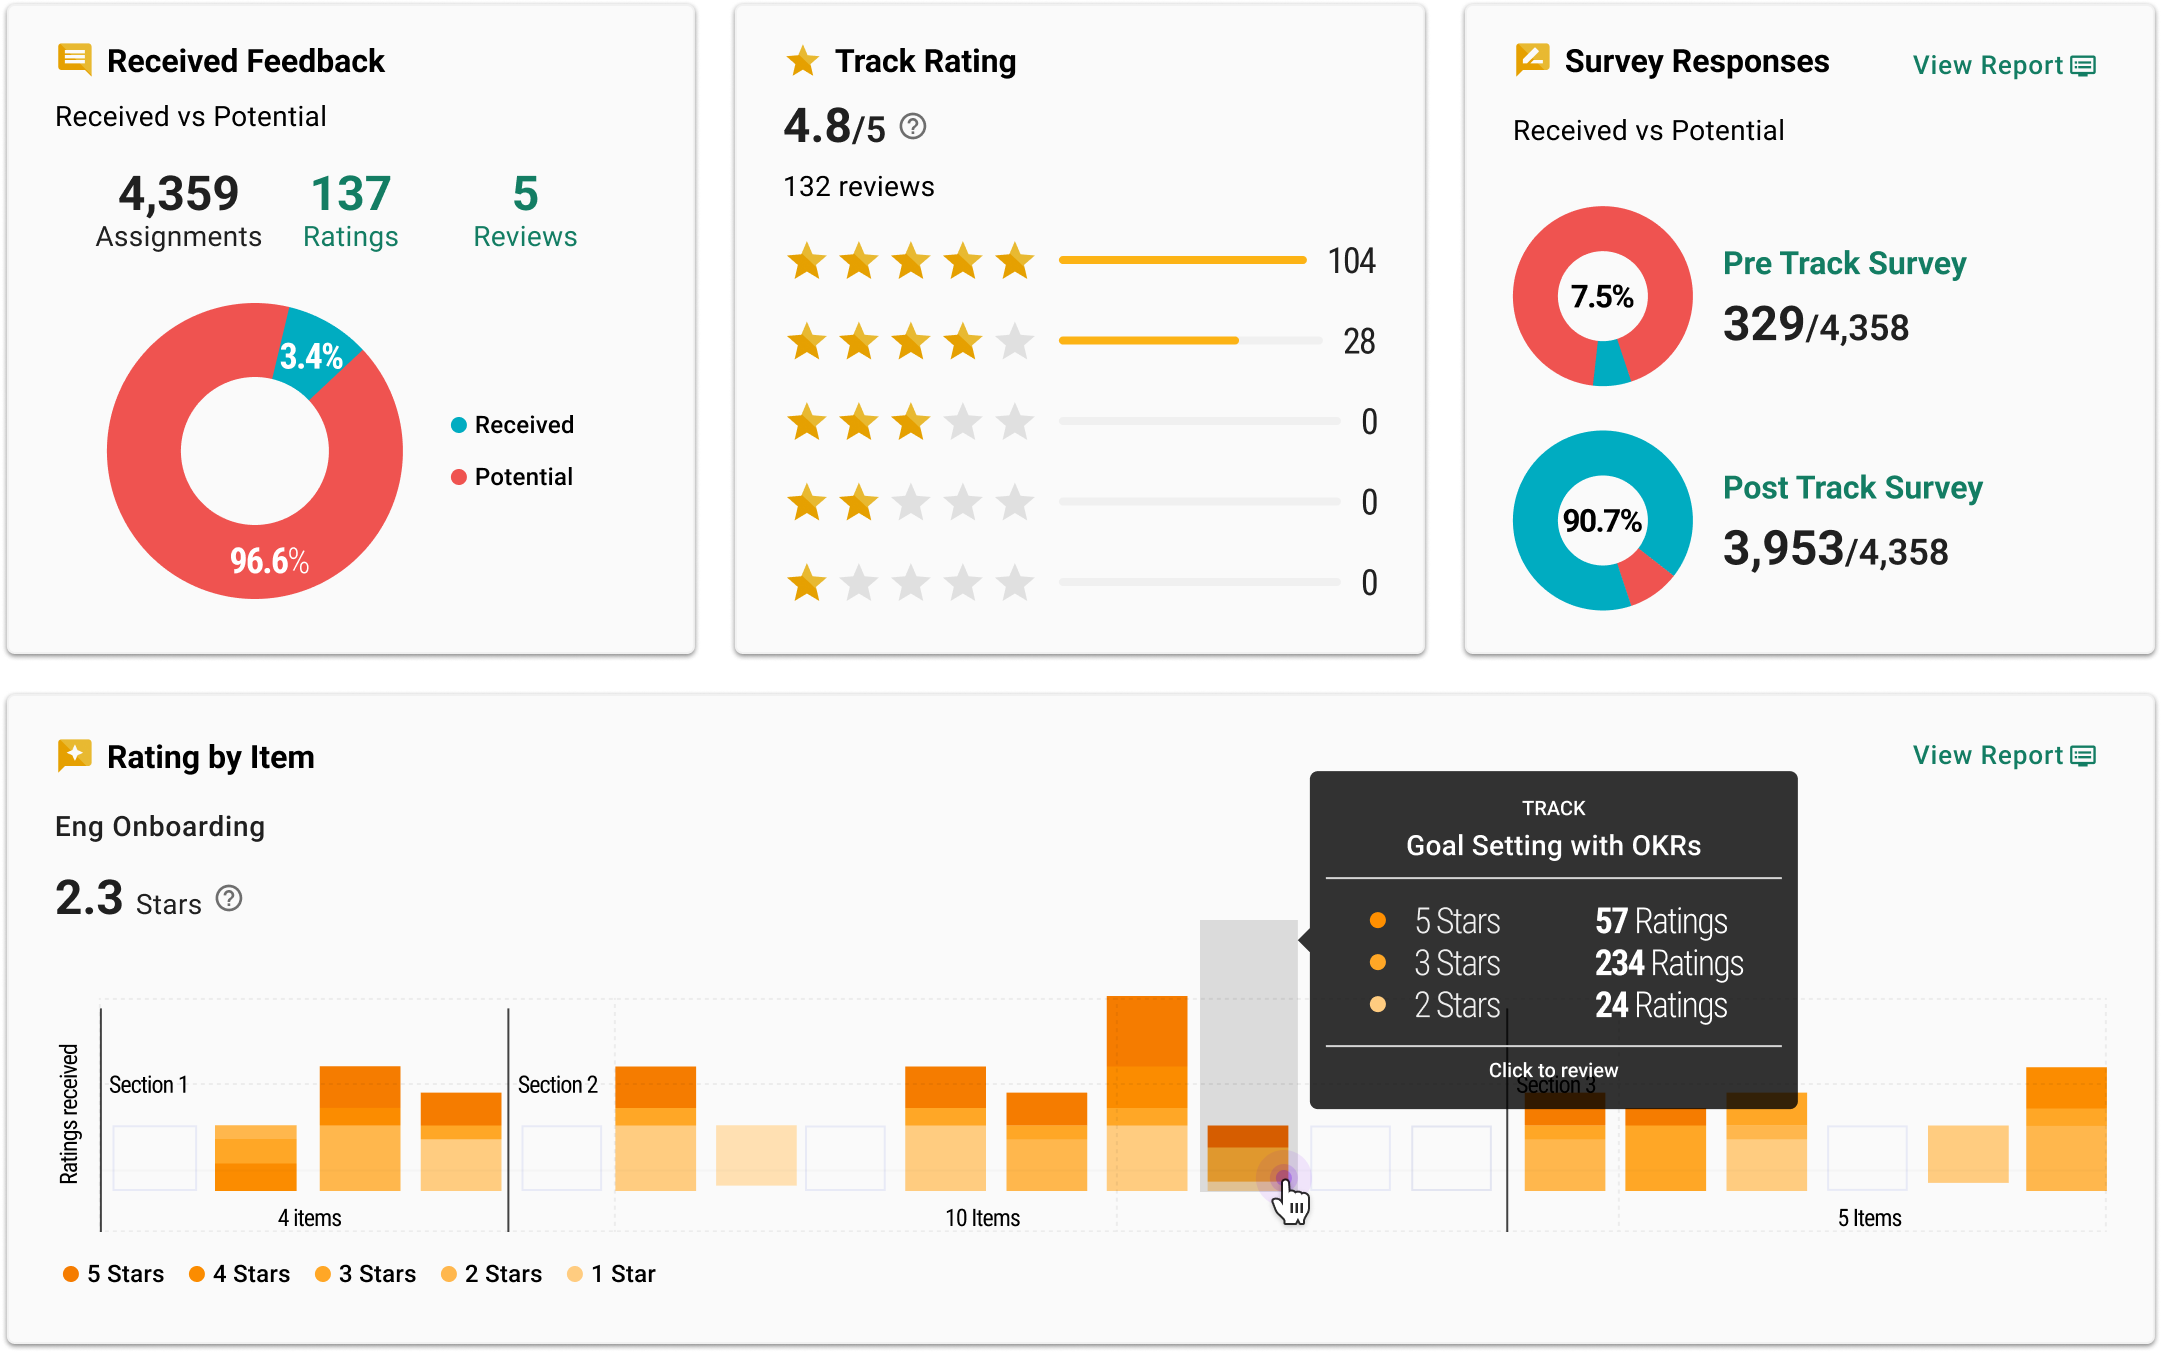
Sentiment
Capture ratings, reviews, and survey responses to understand how content lands.
Drill down and act
Numbers are just the start. Click into any metric and take action.
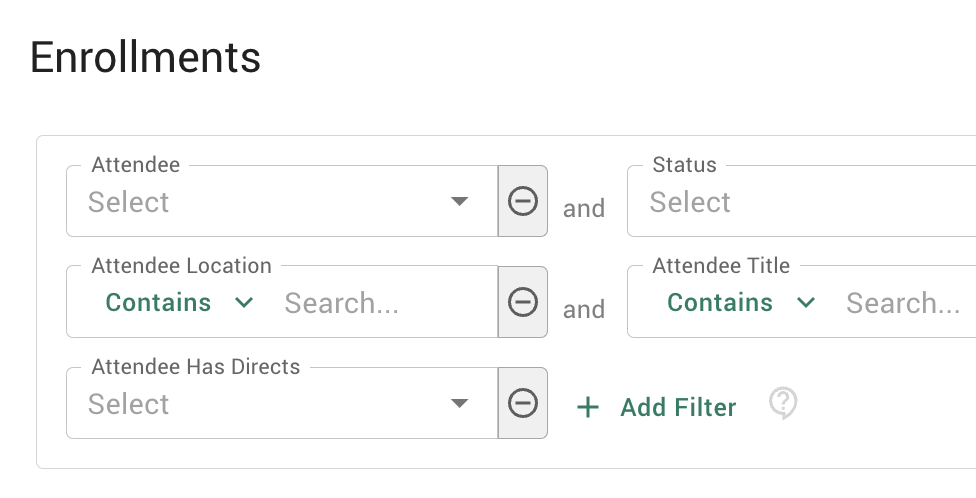
Filter by what matters
Break results down by time period, location, team, role, or cohort to see how certain groups are engaging.
Identify who’s stuck
Go beyond percentages. See the exact learners behind the status, so you know who needs help—or a push.
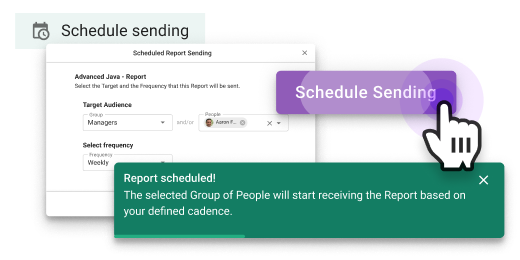
Take bulk actions
Select groups of learners and act immediately. Send reminders, escalate to managers, or nudge entire cohorts.
Slice, Dice, Save, and Share Reports
Customize, save, and share your insights.
Flexible Filters
Filter data on any parameter to get the insights you need.
Saved Reports
Save reports for repeated use and automation.
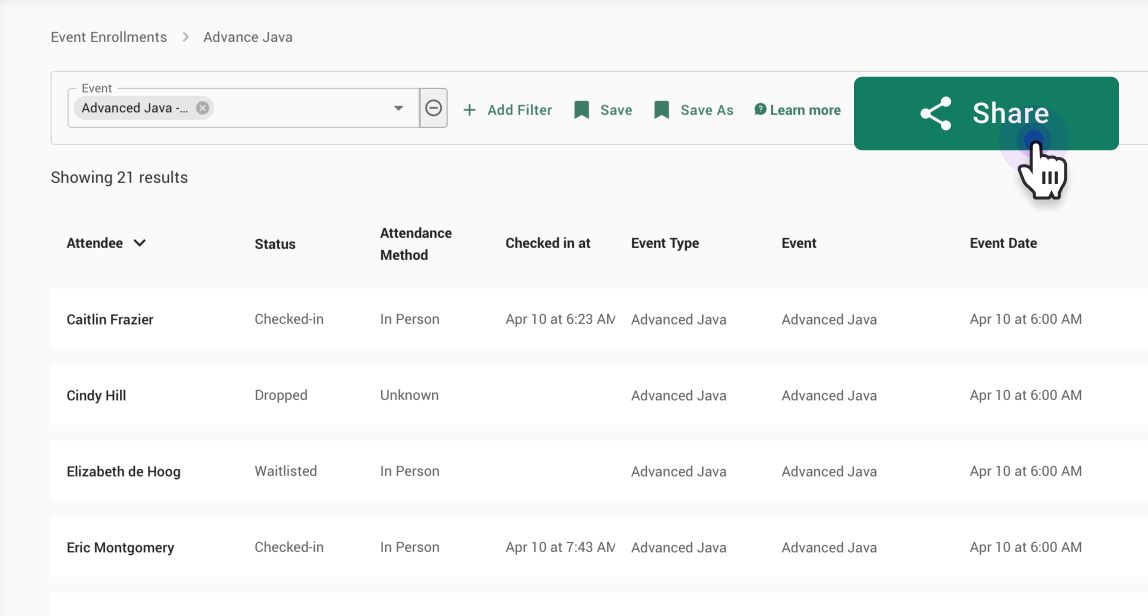
Shared Reports
Share reports with stakeholders, even if they are not administrators.
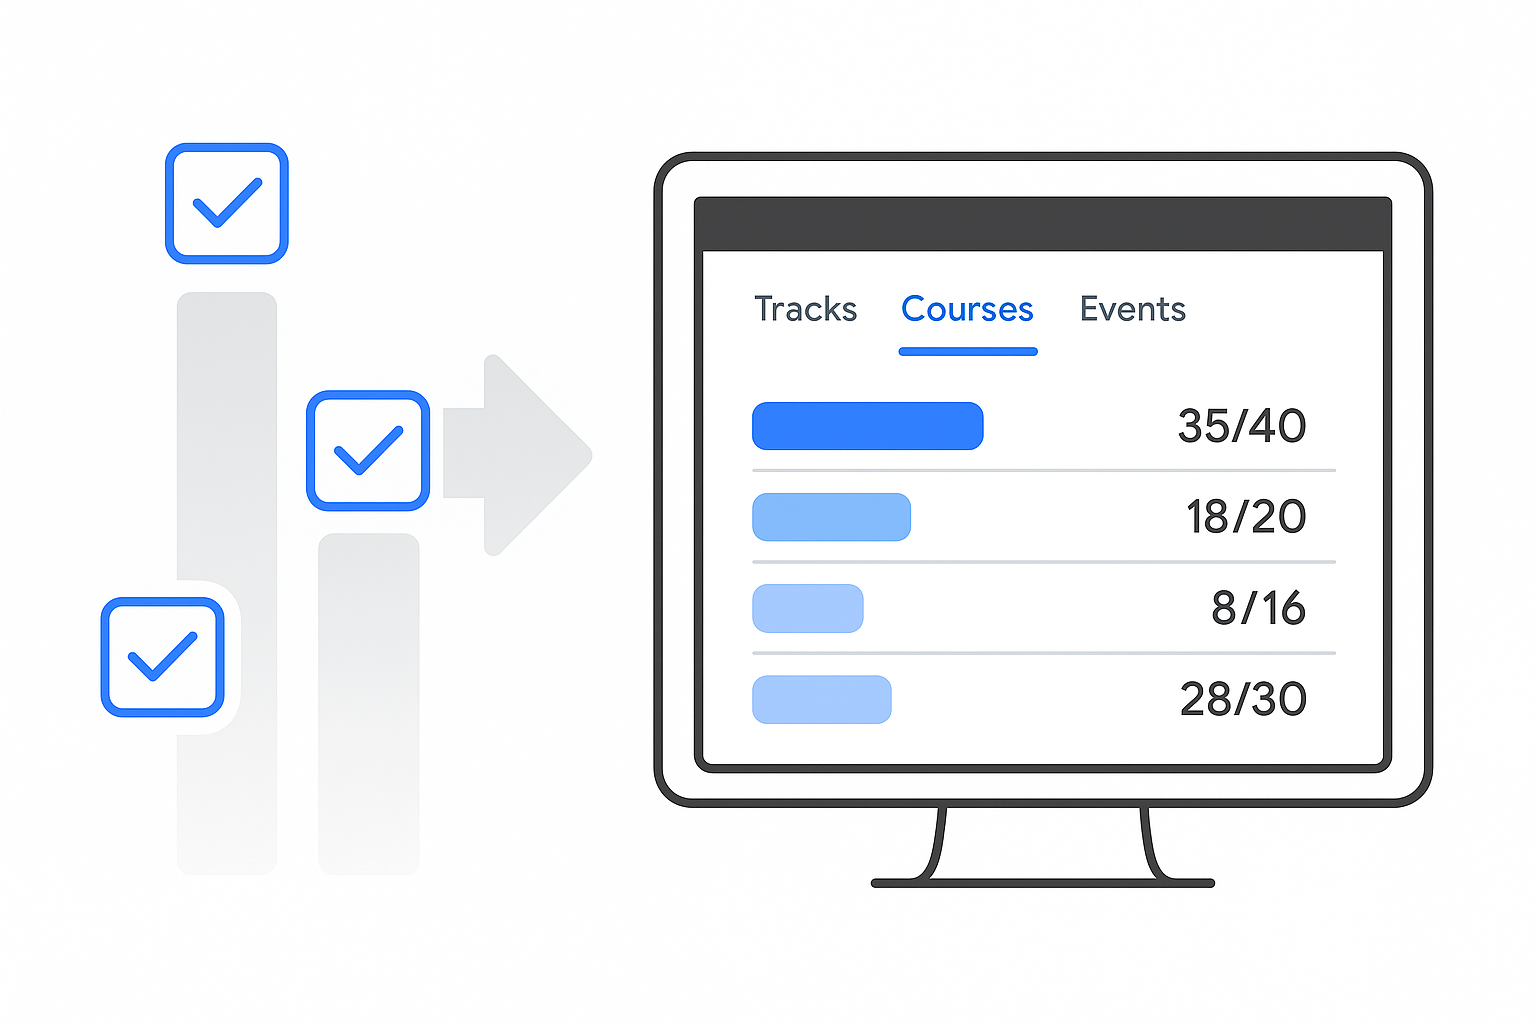
See Insights across all content
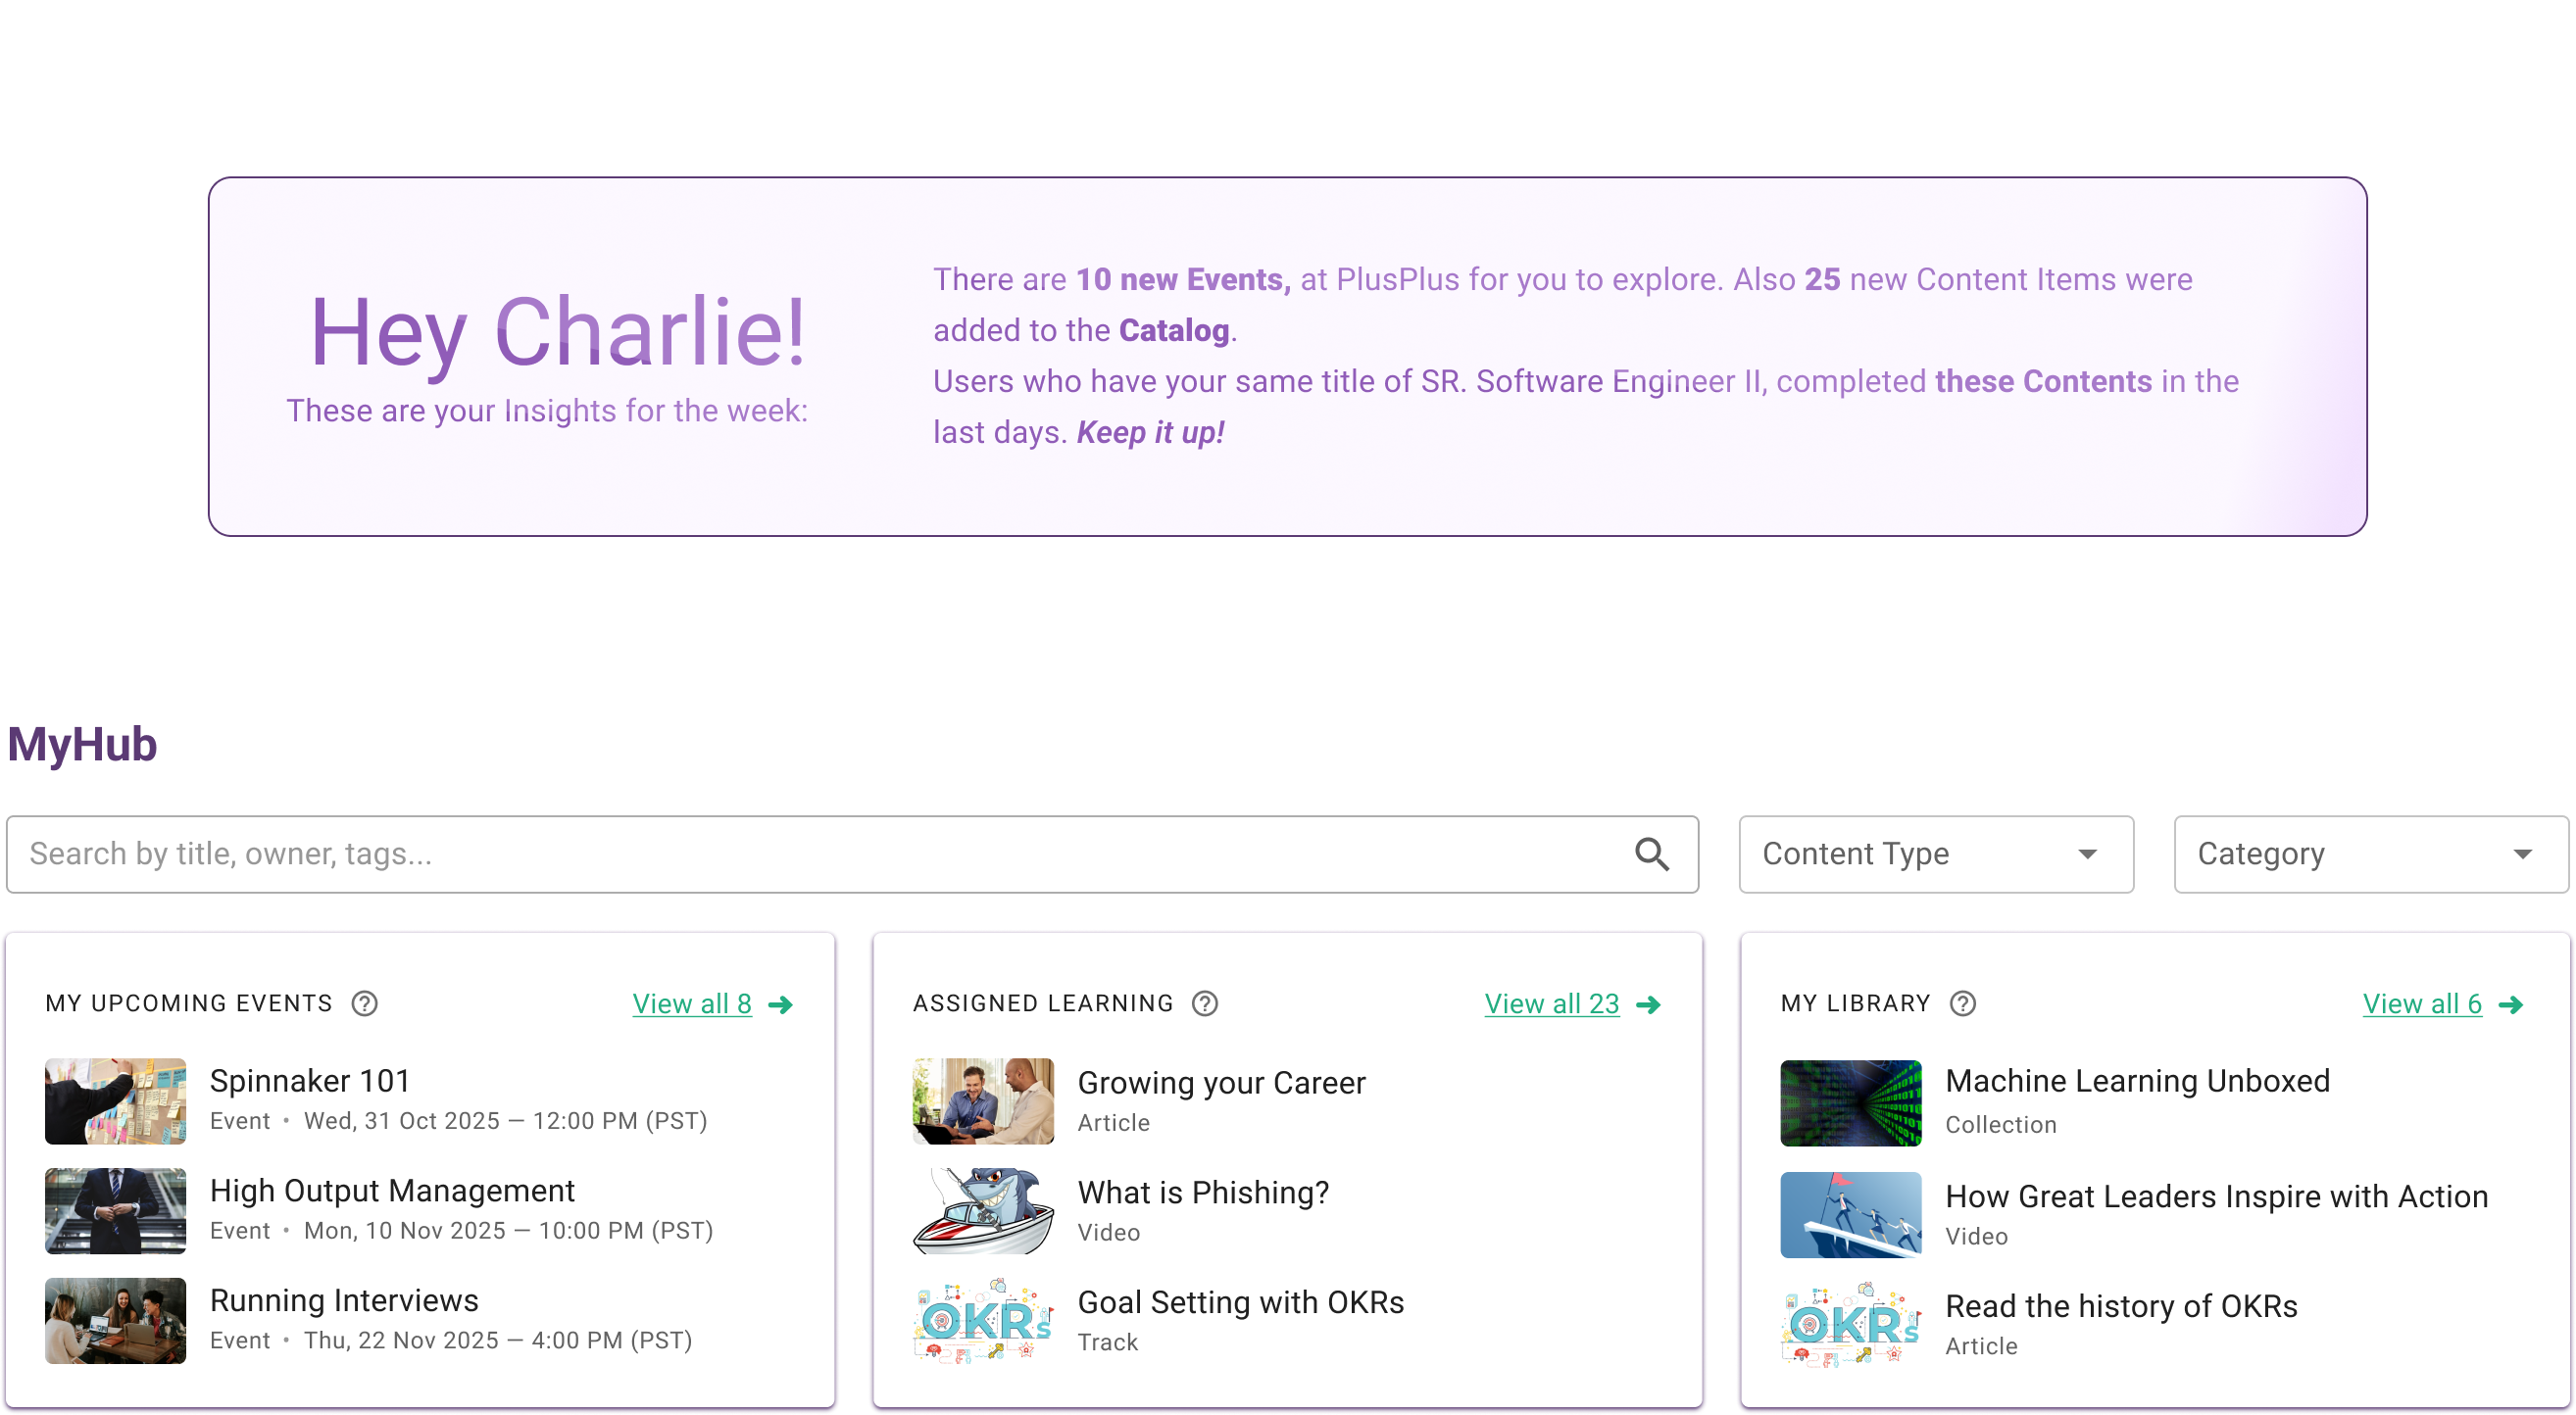
Insights are built into every type of content you deliver — so you always know what’s happening.
Tracks
Drill into tracks to see progress across every content item. View completions, in-progress learners, overdue assignments, and even nested tracks, all with the ability to click deeper into each item.
Courses
Monitor overdue assignments at a glance. Track attempts, pass/fail results, and score ranges so you know not only who finished, but how well they did.
Events
Roll up attendance data, survey completions, and participant ratings across sessions. Spot trends in satisfaction and quickly identify which events are resonating.
Videos
For lightweight content, track starts, completions, and drop-offs where supported. Know if people are actually consuming and how far they’re getting through videos.
Soon: Get AI-powered Insights
AI Insights summarize what matters most so you don’t have to decode charts
Snapshot summaries
Key insights are delivered as short, actionable blurbs you can act on immediately.
Personalized highlights
Each user gets insights tailored to their activity—overdue items, upcoming events, and progress milestones.
Spot shifts instantly
AI flags what’s overdue, what’s trending up, and where engagement is dropping—so you know where to focus.