Our promise to make organizational knowledge accessible, actionable, and always up to date.
Combine live events, on-demand content, and expert connections to create blended learning programs and curriculum.
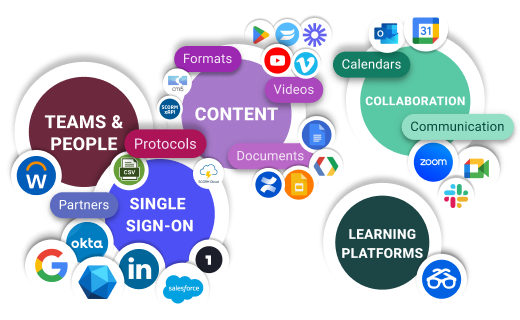
Securely connect to all your other systems.
Empower your experts to unlock tacit knowledge in real time.
Create and curate content from any source.
Enable your people to connect with experts who will help them grow.
Learn how to run successful onboarding programs for teams.
Discover the secret to successful team enablement.
Stories from Tech Enablement leaders at the most innovative companies and enterprises.
Join our growing community of L&D and enablement leaders.
Interviews, Workshops, and Best Practices with Learning Leaders.
Learn best practices for using PlusPlus.
Get in touch with our support team.
Powerful tools designed to measure engagement, optimize content, and drive meaningful outcomes across your programs.
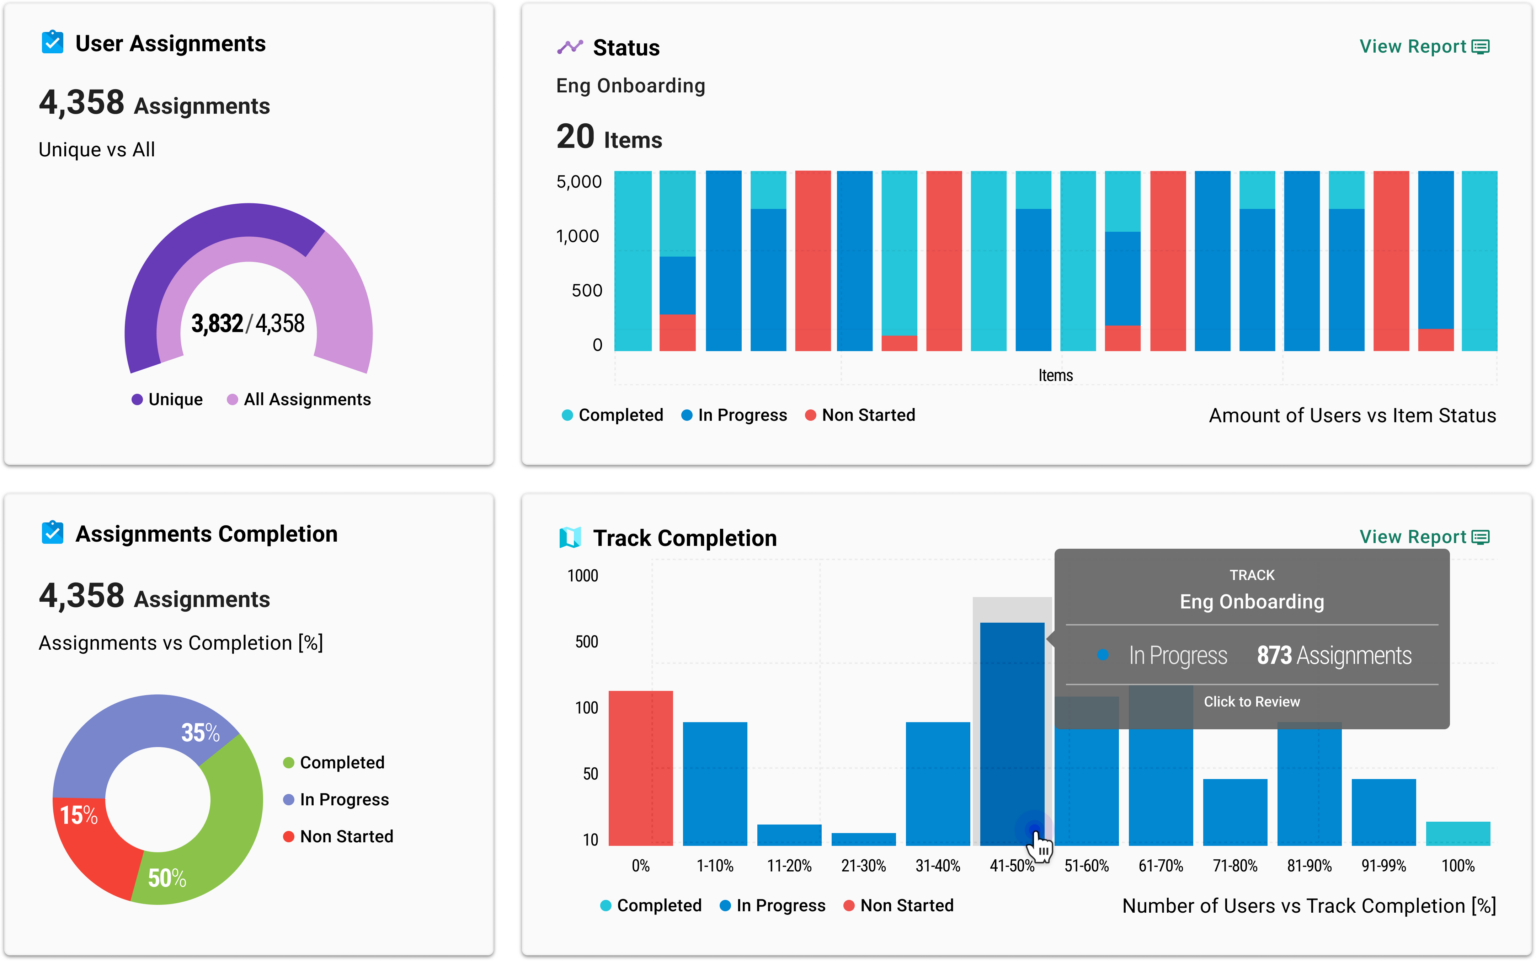
Gain visibility into the performance of your learning with granular, customizable insights.
Track unique assignments, completion rates, and progress statuses.
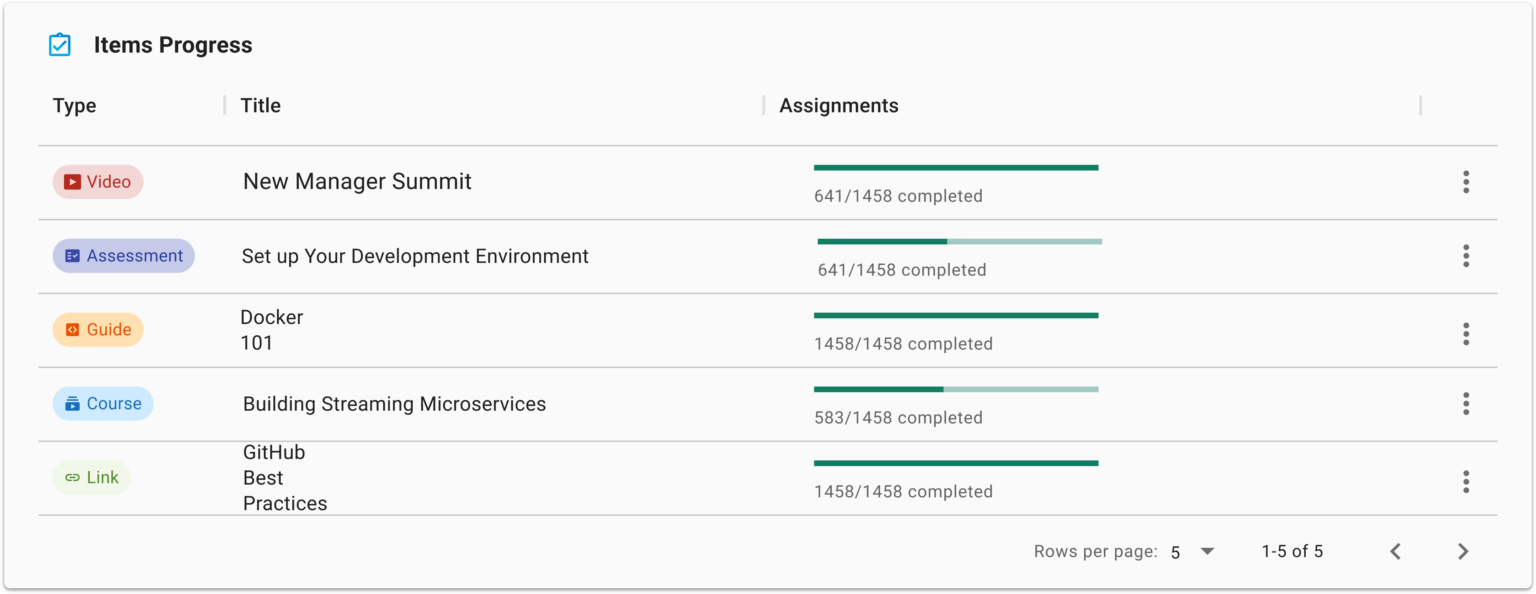
See who has completed each step of a program, as individuals or in aggregate by team or cohort.
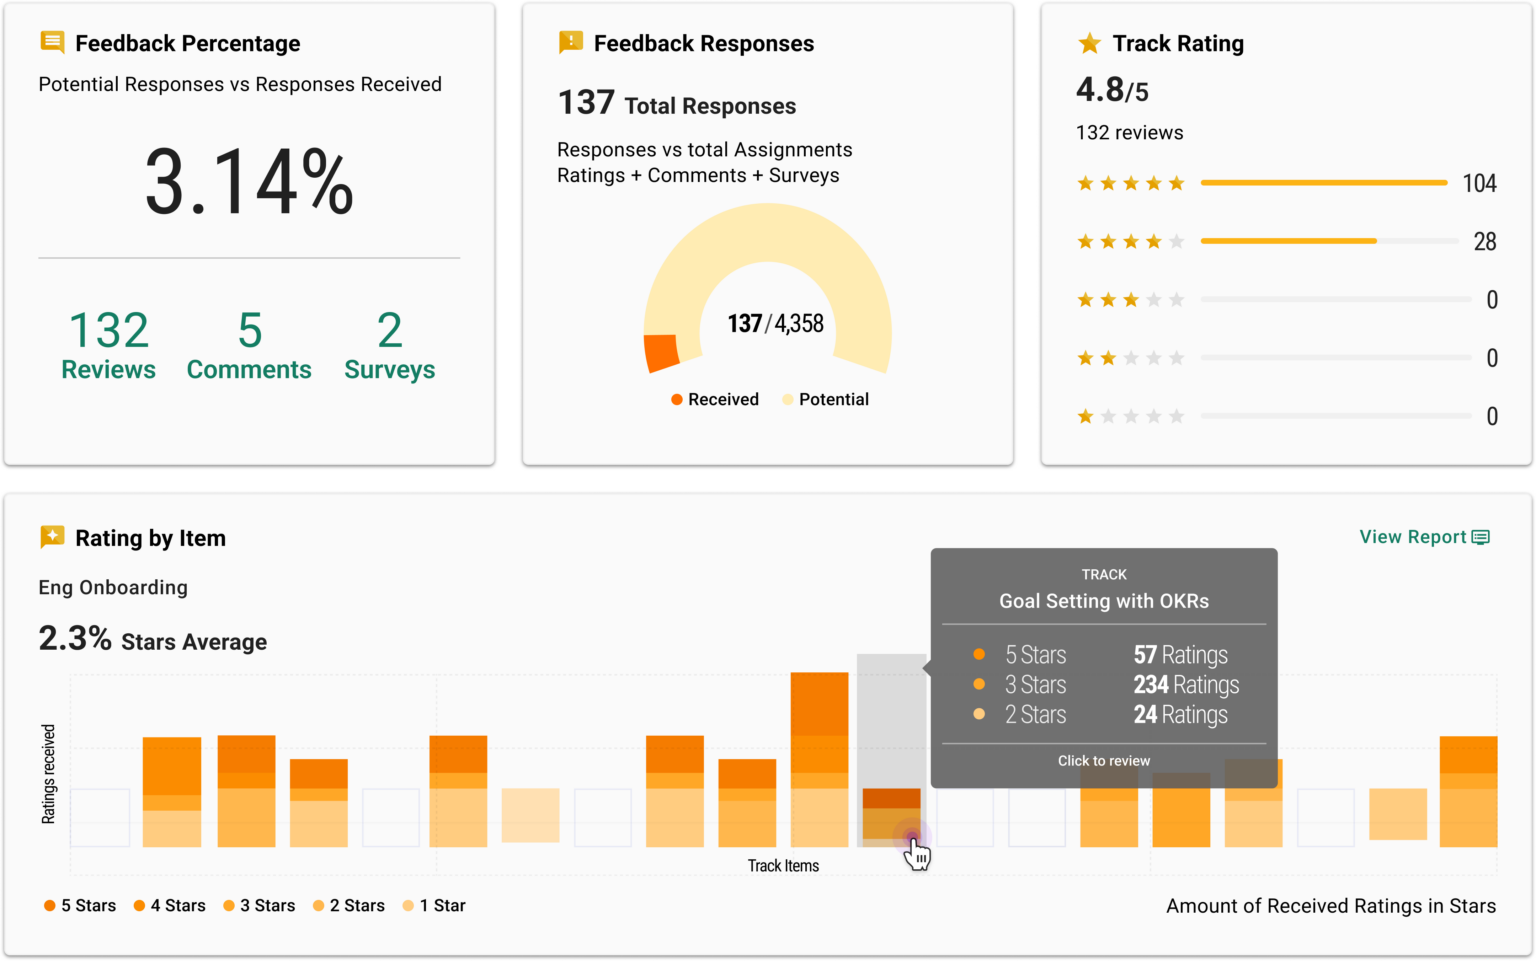
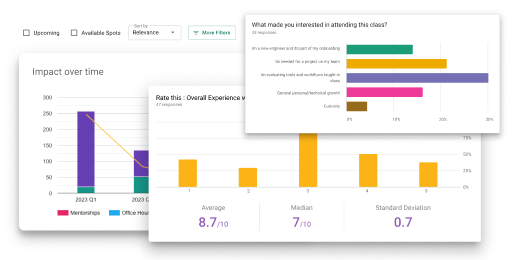
Understand learner Sentiment on both individual items and the overall program.
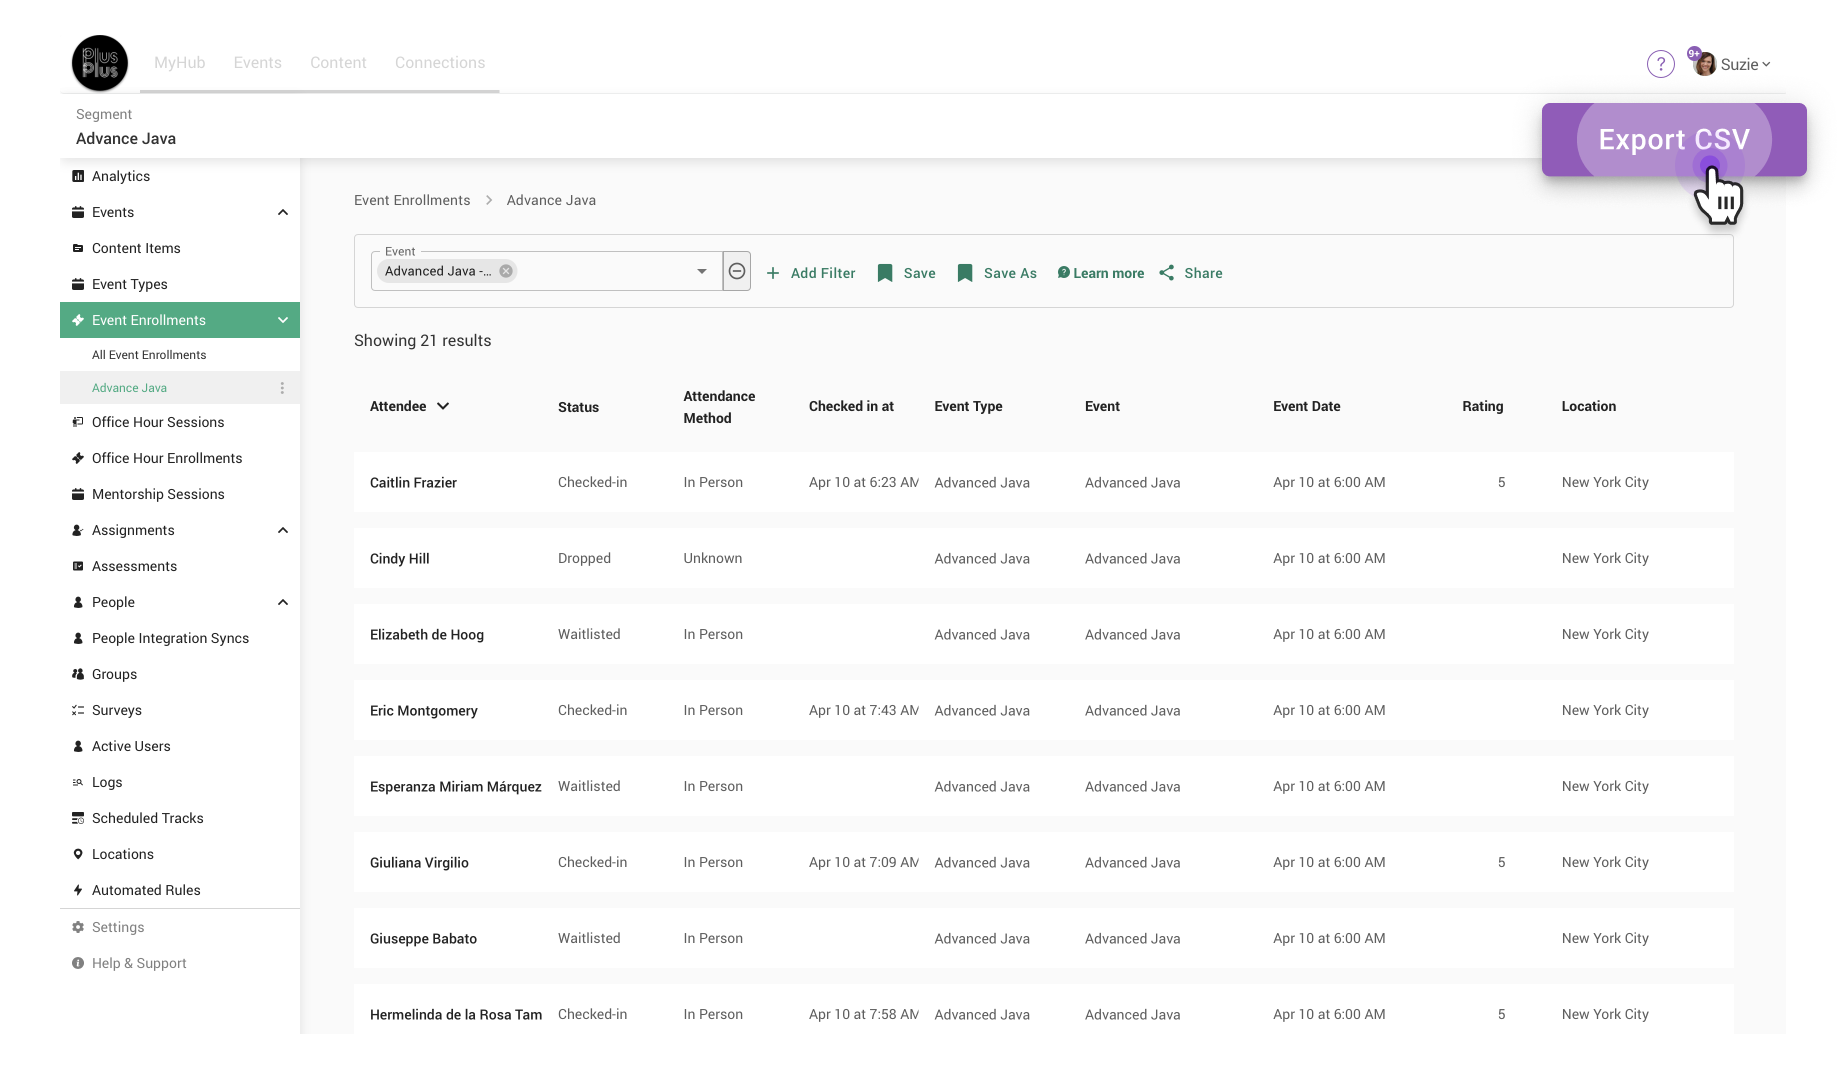
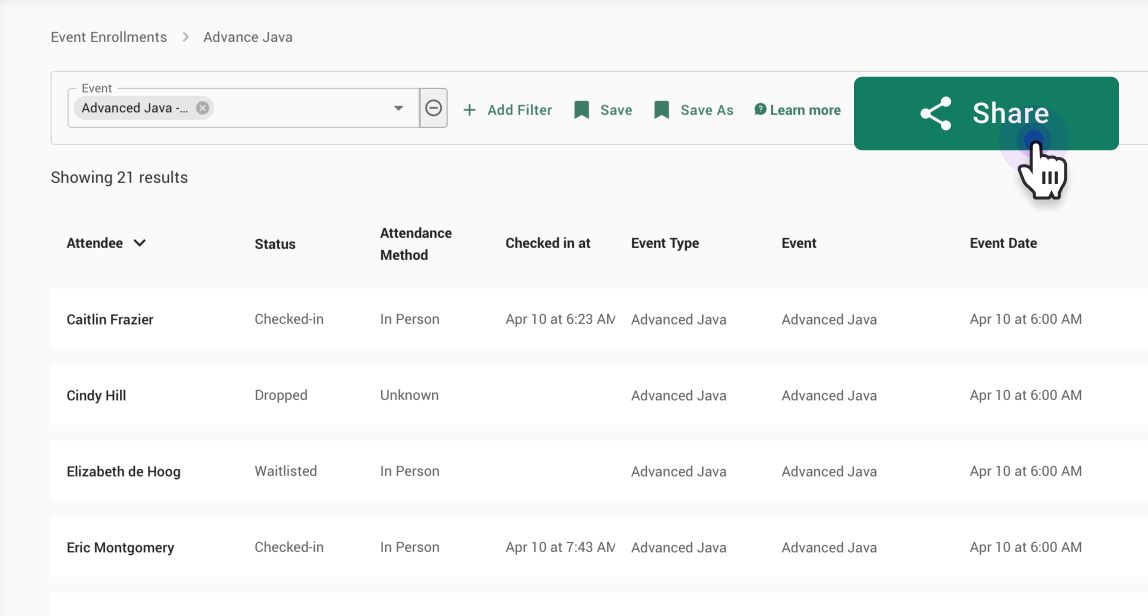
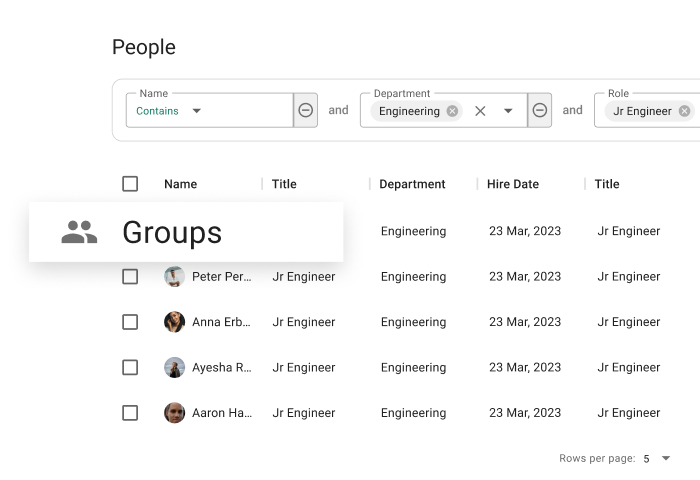
Rich rosters right where you need them
Instantly access and export participant data.
Quickly monitor engagement and progress for any content item or live event.
Customize your view with built-in or custom filters for your specific needs.
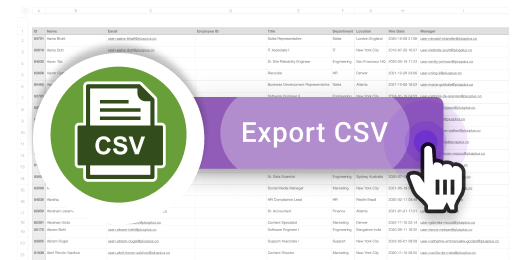
Share data quickly with CSV and PDF exporting options.
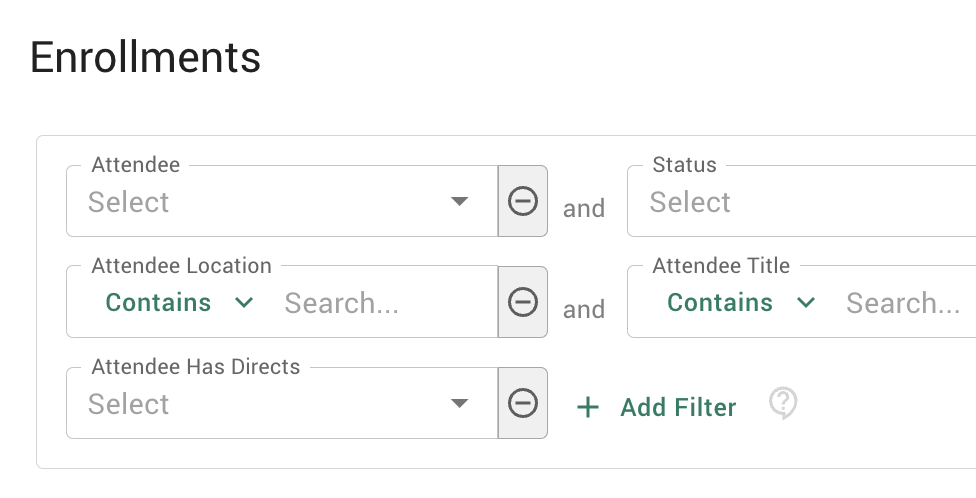
Customize, save, and share your insights.
Filter data on any parameter to get the insights you need.
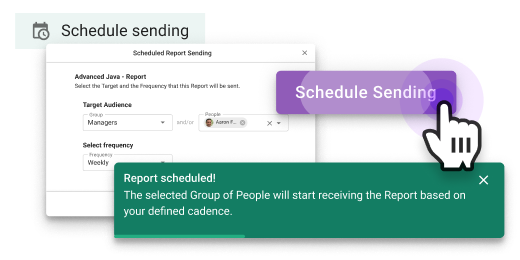
Save reports for repeated use and automation.
Share reports with stakeholders, even if they are not administrators.
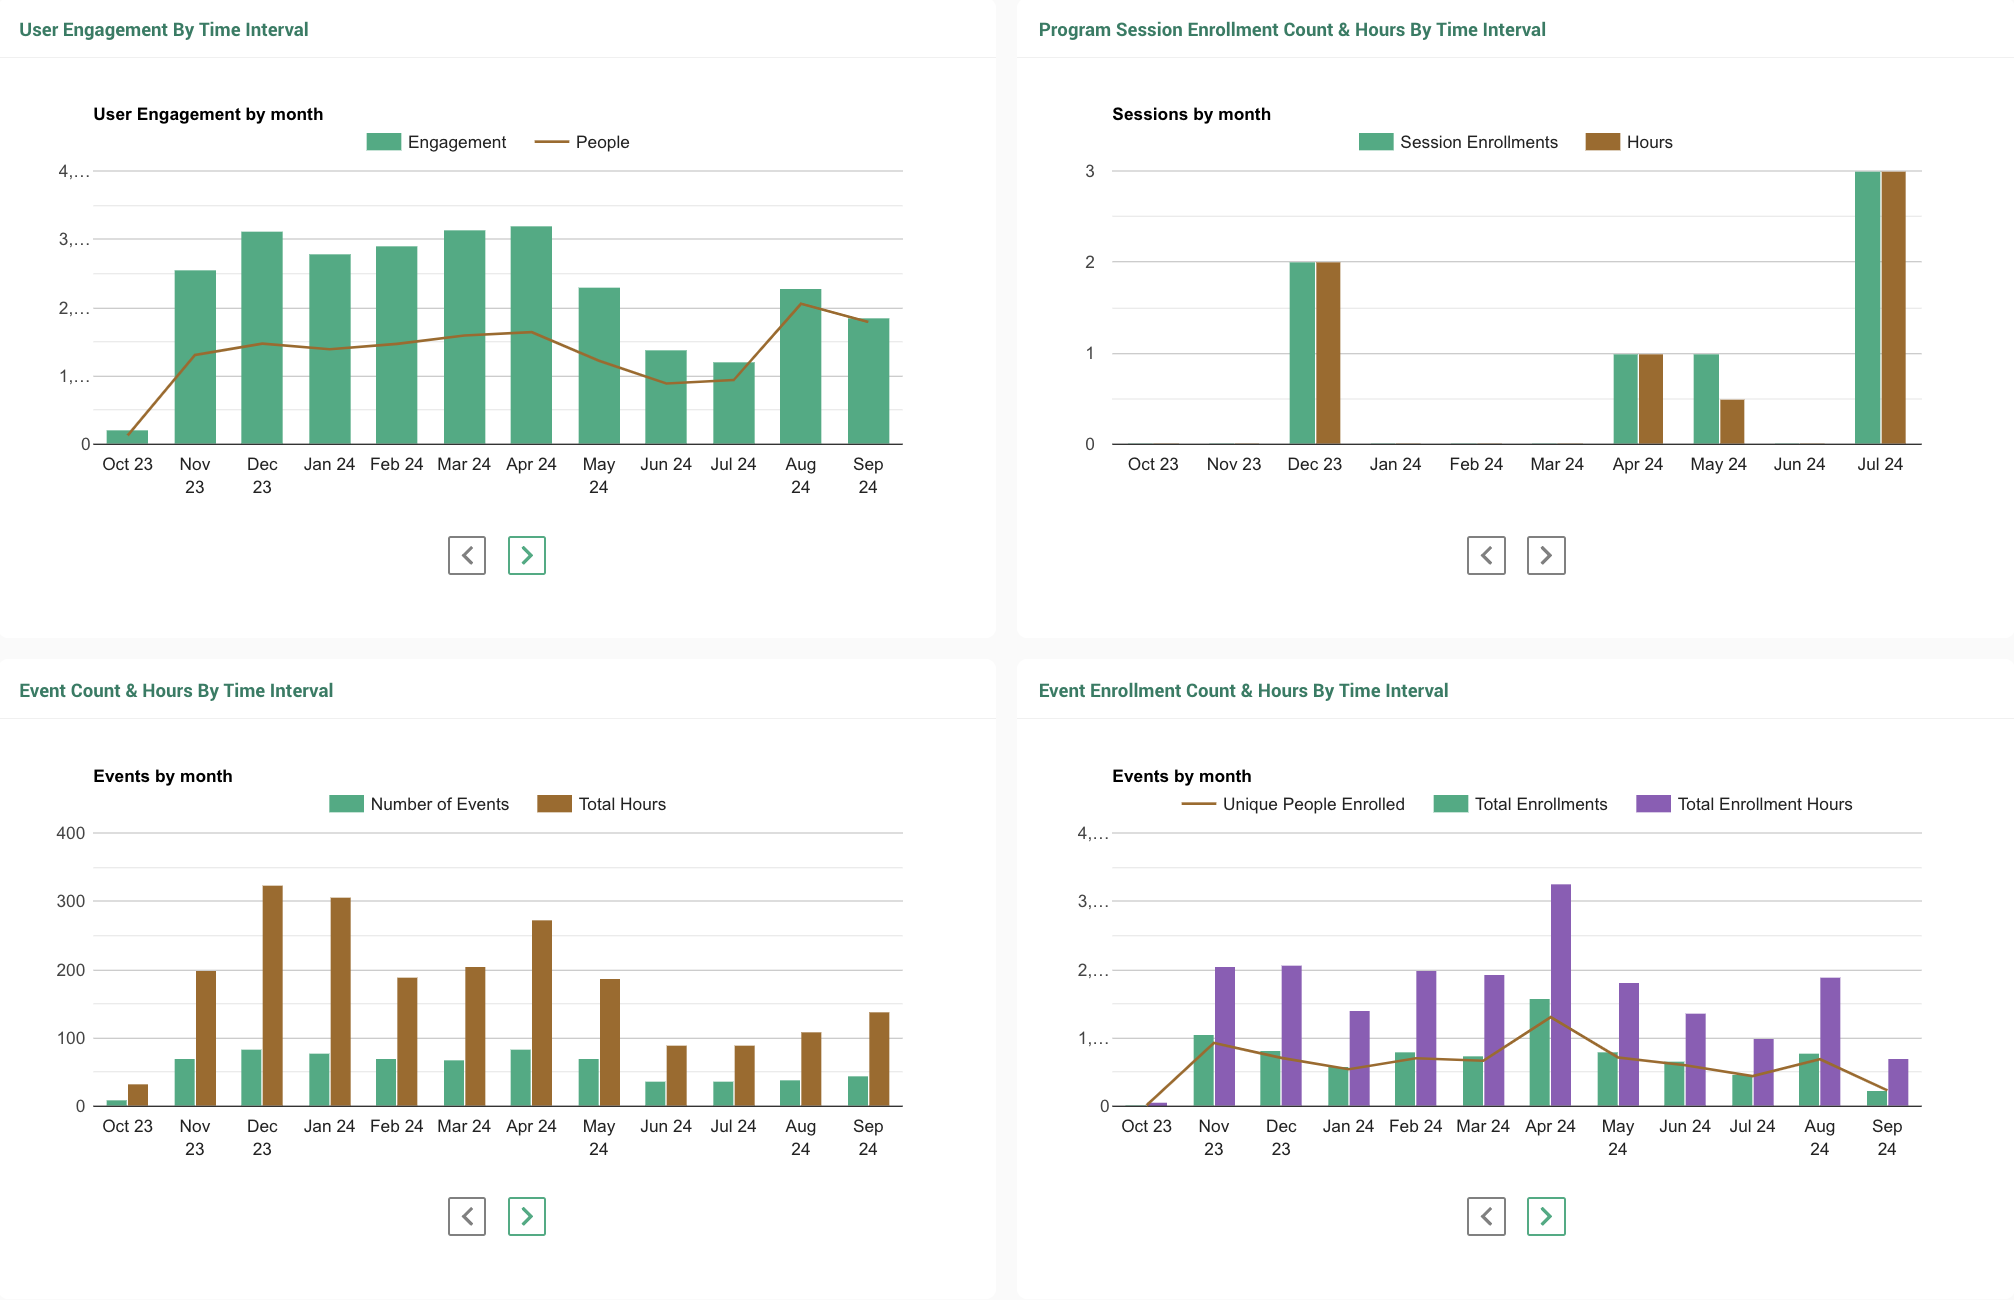
Visualize performance and optimize programs.
Get an overview of program success with key metrics.
Tailor visual data to highlight important insights.
Export data for further analysis or integrate with other tools.
Flexible export and integration options.
Learn more about content integrations
All data included for in-depth analysis. Export any report as a CSV for use in Excel.
Integrate PlusPlus data with enterprise tools in real-time. Use our GraphQL API to connect live data to other systems.
Gain deeper insights and celebrate key contributors.
Generate sharable reports on top experts and achievements.
Use data to understand trends, identify areas for improvement, and make informed decisions.
Provide managers with access to direct reports’ leaderboards.