Intro
Techknowcon recently gathered for an insightful webinar featuring Gail Carmichael, Principal Instructional Engineer at Splunk, and Rajon Tumbokon, Director of Engineering Enablement & Engagement at Splunk. This session was a continuation of a previous discussion about Splunk’s technical onboarding program, focusing on how they measure success and the business impact of their initiatives. This blog post recaps the key points and insights shared by Gail and Rajon, highlighting how organizations can define and utilize learning metrics effectively.
Goals of Splunk’s technical onboarding program
Gail and Rajon began by providing an overview of Splunk’s technical onboarding program, emphasizing its primary goal: to build a world-class engineering organization through effective learning and knowledge sharing. They highlighted the importance of creating a supportive environment where new hires can thrive without fear of failure. The program at Splunk is designed to ensure that new employees quickly become productive and successful, aligning with the company’s broader objective of fostering a safer and more resilient digital world.
Defining metrics for success
One of the key topics discussed was the importance of defining metrics specific to an organization’s onboarding programs. Gail and Rajon shared several techniques for establishing these metrics, emphasizing that they should be tailored to the unique needs and goals of the organization. Metrics play a crucial role in assessing the effectiveness of all learning activities and identifying areas for improvement.
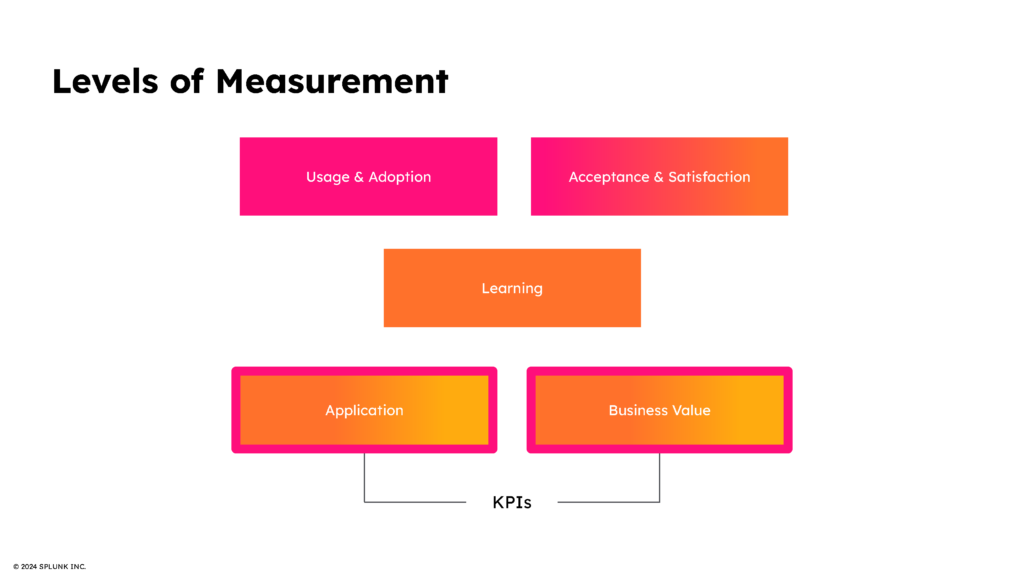
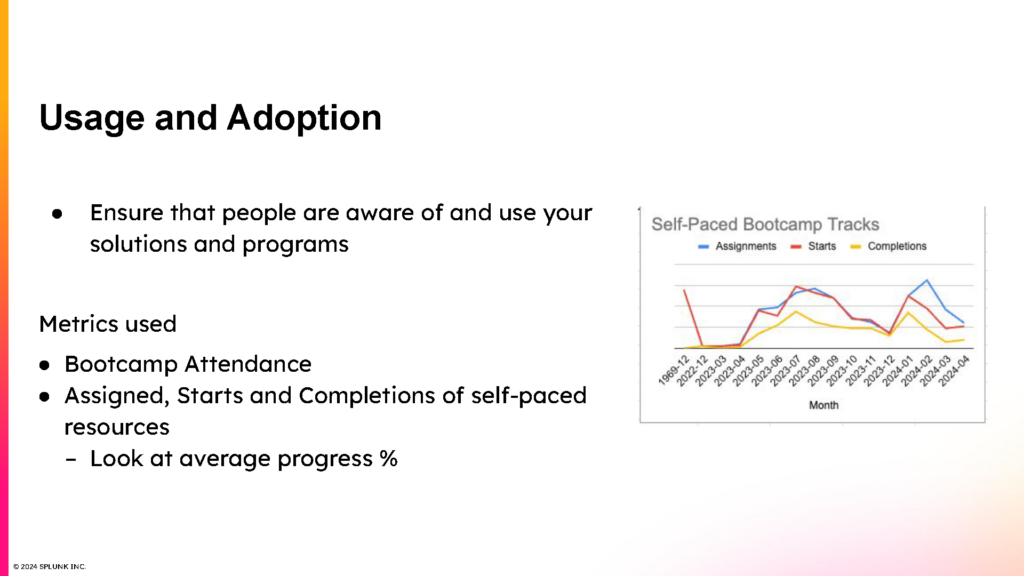
Usage and adoption metrics
The first level of measurement discussed was usage and adoption metrics. Rajon explained that tracking the engagement and participation levels in onboarding programs is essential for understanding their effectiveness. Splunk uses PlusPlus, a learning platform focused on enabling knowledge sharing, to monitor various aspects of their onboarding programs, including attendance at live bootcamps and engagement with self-paced modules. The learning team at Splunk leveraged the PlusPlus API to create custom engagement dashboards in Google Sheets. By analyzing these metrics in their custom dashboards, the team can identify which components of their programs are most utilized and where there might be gaps in engagement.
Acceptance and satisfaction
Next, Gail and Rajon delved into acceptance and satisfaction metrics. They use Net Promoter Score (NPS) surveys to gauge the satisfaction of new hires with the onboarding programs. Since these bootcamps are not mandatory, a high NPS indicates that participants found the programs valuable enough to recommend them to others. This feedback is crucial for making data-driven decisions about potential improvements to the onboarding experience.
Learning and application of knowledge
Gail emphasized the importance of measuring learning outcomes to ensure that the onboarding programs are achieving their intended goals. Splunk employs various techniques to assess learning, such as pre- and post-quizzes and interactive activities within the courses. These assessments help determine whether new hires are retaining the knowledge and skills necessary for their roles. For example, during a recent session, participants were asked to complete a deployment architecture diagram before and after receiving the training, demonstrating their learning progress.
To measure the application of knowledge, Splunk conducts surveys 45 days after new hires begin their roles. This timing allows new employees enough time to integrate into their teams and apply what they have learned while still being recent enough to recall their onboarding experience. The surveys focus on a “confidence score,” which reflects how confident new hires feel in their roles. By tracking these scores over time, Splunk can identify trends and make informed adjustments to their onboarding programs.

Business value metrics
Finally, Rajon discussed the importance of business value metrics, particularly the “time to first merge” metric. This metric measures the time it takes for new hires to make their first code commit, providing a tangible indicator of productivity. By analyzing data from GitLab and Workday, Splunk can track trends and identify bottlenecks in the onboarding process. Since implementing their official onboarding programs, Splunk has seen a 30-40% year-over-year reduction in the time to first merge, demonstrating the significant impact of their efforts.
Conclusion
This Techknowcon event provided valuable insights into how Splunk measures the success of its technical onboarding programs. By defining and tracking specific metrics, Splunk ensures that its onboarding initiatives are effective, data-driven, and aligned with business goals. The lessons shared by Gail and Rajon offer a practical framework for other organizations looking to enhance their onboarding processes and measure their impact effectively.